From the Color Recommendation Committee of the quantitative-MR Study Group of the ISMRM
(Miha Fuderer, Fabio Crameri, Nandita deSouza, Bettina Baeßler, Vikas Gulani, Meiyun Wang, Ruud de Boer, Matt Cashmore, Wolter de Graaf, Kathryn E. Keenan, Dan Ma, Carolin Pirkl, Nico Sollmann, Sebastian Weingärtner, Stefano Mandija, Barbara Wichtmann, Xavier Golay)
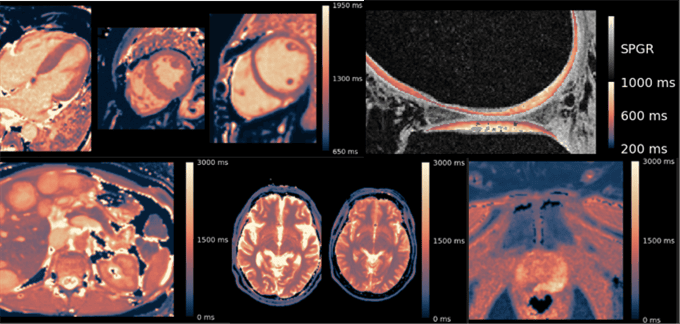
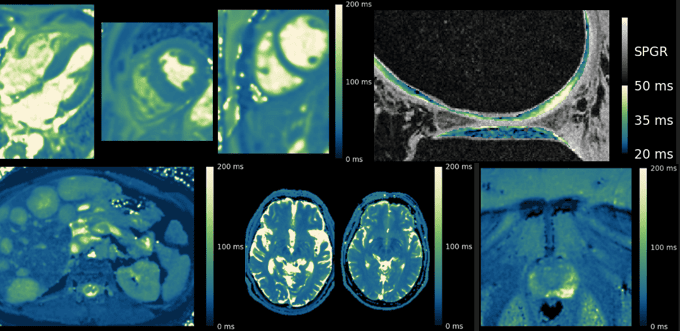
We recommend that the Lipari color-map (Fig. 1) is used for T1 maps, and the Navia color-map (Fig. 2) is used for T2 and T2*. Yet, these color-maps should be applied after applying a logarithm-like function (combined with “windowing”). The color-maps and the logarithm-like function are jointly available here. The same color-maps are to be applied on R1 and R2 and R2*, respectively. This recommendation holds for all anatomies. The value of 0 is to be used to indicate that the calculated relaxation value is unknown (or “invalid”) at that specific pixel, and it always should map to black.
In addition, we recommend that each quantitative relaxation image must be displayed in conjunction with a color bar with adequately readable numbers and units.
These recommendations only achieve the aimed benefits with wide adoption. Thus, we call on industry to adopt the recommendations, on the scientific community to use this recommendations when internally communicating MR relaxation maps – and a fortiori when publishing these. We also call on colleagues to guide the use of these recommendations, e.g., when peer-reviewing.

Figure 1: The Lipari colormap for T1 and R1 maps.

Figure 2: The Navia colormap for T2, T2*, R2 and R2* maps.
